

Create a .NET Core Development Environment using Visual Studio Code - Part 4


This is the fourth article in my Create a .NET Core Development Environment using Visual Studio Code series. You can read my previous posts in the series from the following links.
Create a .NET Core Development Environment using Visual Studio Code - Part 1
Create a .NET Core Development Environment using Visual Studio Code - Part 2
Create a .NET Core Development Environment using Visual Studio Code - Part 3
In this article, I will be talking about debugging .NET Core applications using Visual Studio Code. We all know that debugging is an indispensable part of programming. Most of our programming time is devoted to debugging the code written by us or others. So it is really necessary that programmers need a very smooth debugging experience while coding. Most of the IDEs provide excellent debugging options. Visual Studio’s debugging capabilities are so powerful that it provides a lot of debugging features like breakpoints, code stepping, variable inspection, call stack, debug console window etc.
In this article, we will see how to bring a smooth debugging experience for .NET Core applications in Visual Studio Code. For debugging .NET Core applications in Visual Studio Code we need to install the C# extension for VS Code. You can refer to my first article in the series for more information on this.
So for the debugging demonstration, we shall be creating a .NET Core Web API project using .NET CLI.
Create a folder named DebuggingExample and open that folder in Visual Studio Code.
Open the terminal and enter the command
dotnet new webapi --name DebuggingExampleApi. This shall create a .NET Core Web API project in the folder.Open the ValuesController.cs file in the Controllers folder. This shall make the C# extension display a prompt that will offer to generate build tasks and launch configurations for your project.
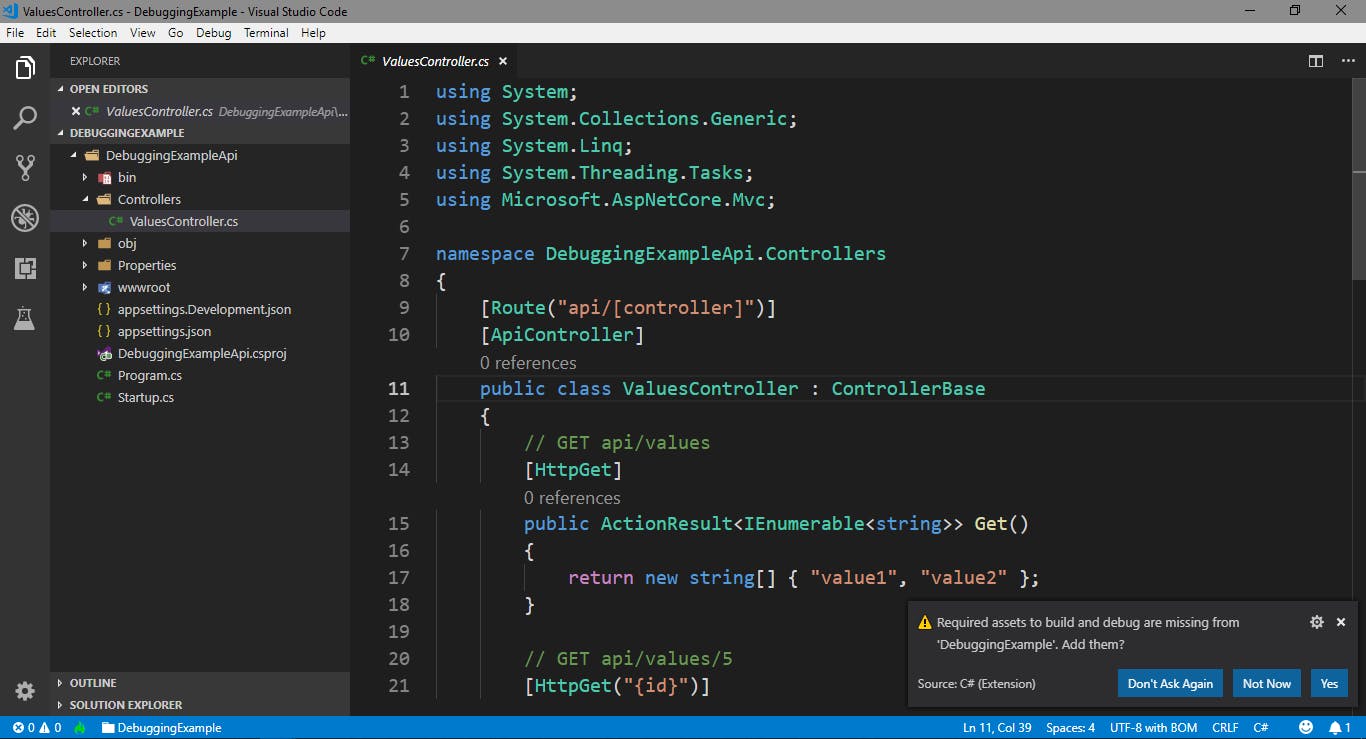
Click Yes, and VS Code will create a folder name
.vscodein the project directory. The directory contains two files -launch.jsonandtasks.json. These two files are important for VS Code as these are the configuration files required for building our project and debugging it.tasks.jsonis used to configure what command line command is executed to build your project, and launch.json configures the type of debugger you want to use, and what program should be run under that debugger.launch.jsonconfigures VS Code to run the build task from tasks.json so that your program is automatically up-to-date each time you go to debug it. For learning about advanced debugging configurations, you can visit here.
Now let's make a small change in the
Get()method in theValuesControllerto return anActionResult<IEnumerable<string>>. We shall change the inline return function and assign the returned value to a variable. This will help to inspect the variable values during debugging.
public ActionResult<IEnumerable<string>> Get()
{
    var texts = new List<string>();

    texts.Add("value1");
    texts.Add("value2");

    return texts;
}
Now set a breakpoint on this method. Similar to Visual Studio, we can set a line breakpoint in source code by clicking in the left margin of a source code file, or by putting the cursor on a line of code and pressing F9. The breakpoint appears as a red dot in the left margin of the editor.
For starting debugging, press
F5. This will start the application by automatically attaching the debugger to our application. This will also open the start page in our default browser.Now call the controller method on which we have set our breakpoint from the browser. Type
localhost:5001/api/valuesin the address bar and press enter. We can see that the execution is stopped at the breakpoint we have set, which helps us in knowing the current program state while debugging.
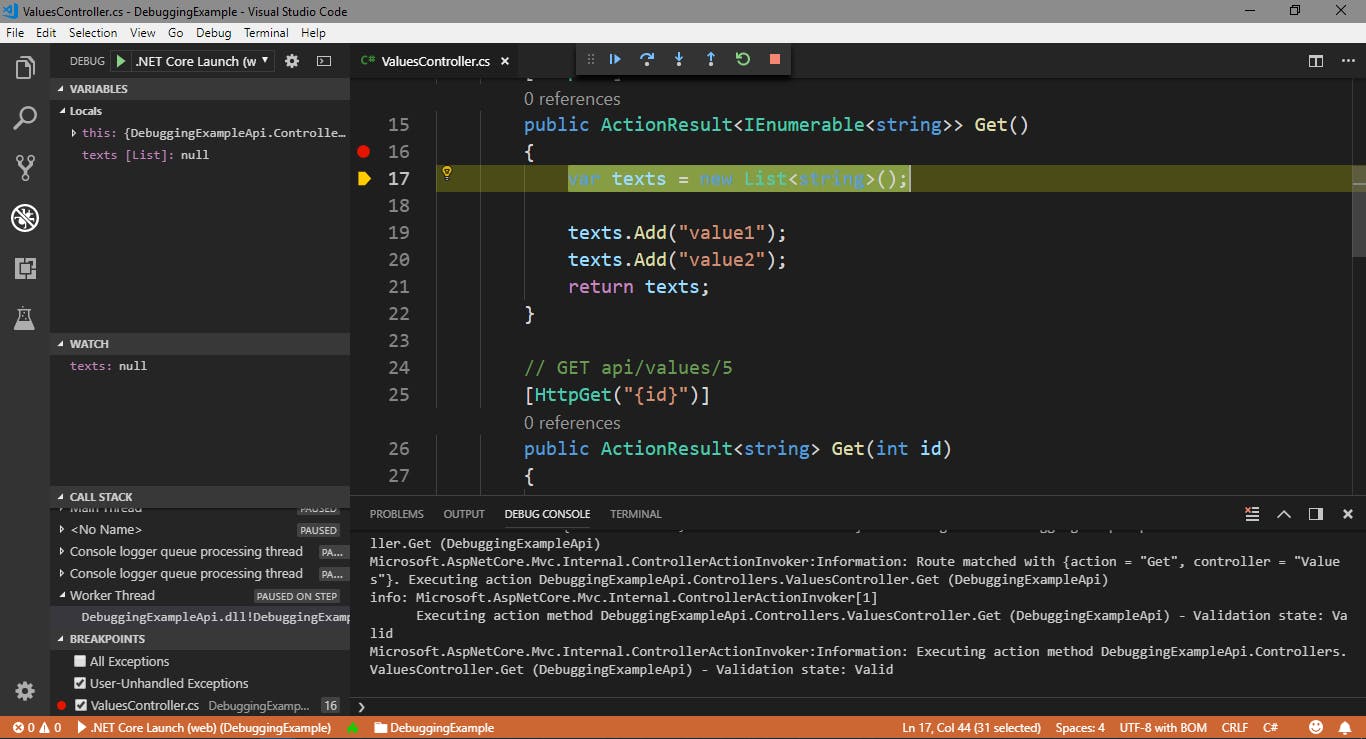
We can see that the Debug view of VS Code is opened on the left side of the editor. The Debug view displays all information related to debugging. We can also notice that a debug toolbar has appeared on the top of the editor. The debug toolbar can be used for code navigation options while debugging. The following options are available in the debug toolbar.
Continue / Pause (
F5)Step Over (
F10)Step Into (
F11)Step Out (
Shift+F11)Restart (
Ctrl+Shift+F5)Stop (
Shift+F5)
The debug view contains the following sections
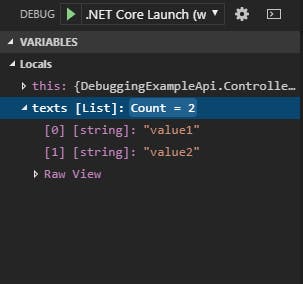
- Variables - This section shall list all the variables and their values in the debug session. In our example, we can see that our
textsvariable is listed in this section with the default value ofnull. When we step over the lines of code, we can notice that the variable values are changed when each string is added to the list. We can even modify the variable values in this section.
- Variables - This section shall list all the variables and their values in the debug session. In our example, we can see that our
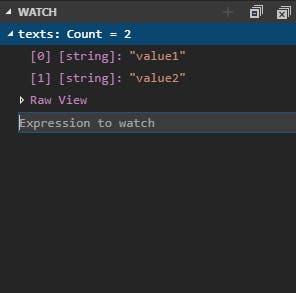
- Watch - This section is similar to the Variables section. Here we can watch a particular variable we wish to debug. Just add the variable name to the expression list of the watch window to start watching that variable.
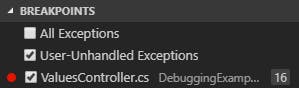
- Breakpoints - This section displays all the breakpoints we had set in the source code for debugging.
Summary
In this post, I have explained how to debug .NET Core applications in Visual Studio Code. Even though the debugging capabilities of Visual Studio Code are not up to the level of Visual Studio, it does a lot of work most developers need. For more details about debugging features provided by Visual Studio Code visit this link.
Visual Studio Code is a powerful text editor from Microsoft which can be supercharged by an awesome collection of extensions created by the community. The community is so great that we can expect a lot more cool extensions and features coming to VS Code which will make developing .NET Core applications in this lightweight, cross-platform editor more smooth and fun.